“Wind-Jeannie“ is designed to help insurance companies prepare for large windstorm events by providing information on the expected magnitude and geographical extent of an event loss in advance of it occurring. Wind-Jeannie makes available insured property market loss forecasts for windstorm events across Europe, Japan and Australia for the forthcoming 72-hour period. It computes the expected insured loss estimates using gust forecast data provided by the German Weather Service (DWD) in the case of Europe, and by the European Centre for Medium-Range Weather Forecasts (ECMWF) in the case of Australia and Japan. The loss forecasts are updated every 12 hours.
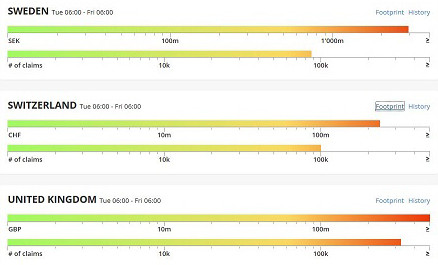
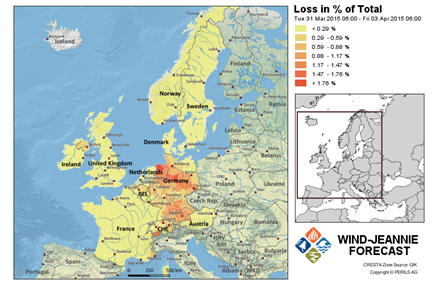
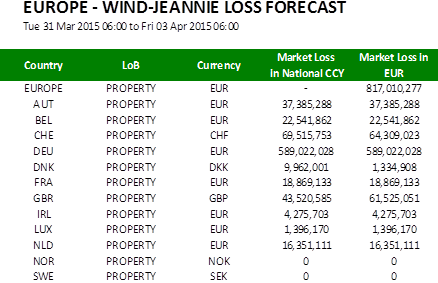
The loss calculation is based on detailed three-day gust forecasts, plus vulnerability and exposure data captured by PERILS between 2009 and 2018. For Europe, loss forecasts are provided per country and CRESTA zone, as well as for all countries combined. For Japan, loss forecasts are provided per CRESTA zone. For Australia, loss forecasts are broken down per state and postcode. In addition, footprints and maps of the forecasted gusts and losses can be downloaded both in map format and as Excel workbooks. Needless to say, the more event loss data PERILS will collect in the future, the more reliable the loss forecasting will become.
It is important to note that loss forecasts can vary greatly from one forecast to the next. In general, forecasts become more reliable the closer in time they are to the peak of an actual windstorm event. For example, if a storm reaches its peak in a given country overnight, the loss forecast made at the previous evening will usually be more accurate than earlier forecasts.
Like any other loss model, Wind-Jeannie is a work in progress. Users of Wind-Jeannie are invited to help us enhance the platform by giving feedback on their experiences with the forecasted windstorm losses. This will help improve the loss forecasts and make them more realistic. Our vision is that, over time, short-term windstorm loss forecasting will become as reliable as daily weather forecasts. However, only a joint effort will help us move closer to this vision.
As the famous Danish physicist Niels Bohr once noted, forecasts are difficult, especially those concerning the future. This is particularly true for windstorm loss forecasting. As a result, it is important to warn users of Wind-Jeannie against simply taking the forecasted losses provided by Wind-Jeannie at face value, because the reality can be very different from the forecast.
To find out more, go to the Wind-Jeannie website: www.wind-jeannie.org
All data providing companies and subscribers to the PERILS Industry Exposure & Loss Database can receive free access to Wind-Jeannie. Dissemination of any information from the Wind-Jeannie website to third parties is prohibited.
If you would like to access Wind-Jeannie or have any feedback or questions about the website, please contact us at:
PERILS AG
Marktgasse 3, 8001 Zurich, Switzerland
E-Mail: contact@perils.org
Phone: +41 44 256 81 00