The PERILS Industry Loss Index Service provides index values which can be used in industry loss-based ILS, ILW or other derivative transactions. The underlying data for the index corresponds to the loss data collected for the PERILS Industry Loss Database.
Basis risk can be significantly reduced with the use of structured triggers with loss weighting factors per CRESTA, country and/or Line of Business.
First index value report is made available six weeks after the event.
Updates after three, six and twelve months.
Subsequent reports only if deemed necessary. Reporting closed in any case after 36 months.
PERILS Loss Index values can be used as underlying triggers in industry-loss-based ILS, ILW or other derivative transactions.
The risk assessment of PERILS-based transactions can be performed with the PERILS Industry Exposure Database.
As the underlying loss data for Index values stem from the same sources and are calculated using the same methodology as the exposure data, full consistency between loss triggering and risk assessment is ensured.
Basis risk can be significantly reduced with the use of structured triggers with loss weighting factors per CRESTA, country and/or Line of Business.
PERILS’ independence ensures that the Loss Indices are objective and free from any inherent conflict of interest.
The PERILS Industry Exposure & Loss Database provides new benchmarks for evaluating insurance portfolios using market exposure (sums insured) and market event loss data (insured loss amounts). Both are key market measuring sticks and complement current premium-based market position indicators. The new insights gained from this can be used in portfolio steering, claims management and strategic business planning.
The PERILS Industry Exposure & Loss Database serves as an excellent source for validating probabilistic catastrophe risk models. Post-event risk model calibration, which is currently being carried out using a variety of sources with varying event loss estimates and industry exposure portfolios, may now be performed using the new PERILS benchmark data. In addition, by comparing the PERILS event loss data with the PERILS industry exposure, it becomes possible to derive damage degrees and to correlate them with event intensity measures provided by PERILS, such as modelled and observed gust values. This also enables the validation of the damageability function in catastrophe risk models.
PERILS industry data contribute to risk-based solvency assessments by allowing the benchmarking of exposures, event losses and modelled losses against the market. Furthermore, custom-made triggers for fully collateralized ILS and ILW transactions are provided by the PERILS Industry Loss Index Service. In combination, this helps to address both basis risk as well as credit risk concerns, which are both central to state-of-the-art solvency regulations.
PERILS Industry Loss Index Service (Loss Indices) allows the use of PERILS industry loss estimates as triggers in Insurance Linked Securities (ILS), Industry Loss Warranty contracts (ILW) or insurance risk derivatives. The Loss Indices are based on actual insured loss information collected directly from insurance companies writing property business in the affected territories. Structured triggers, with the use of weighting factors per CRESTA, country and/or Line of Business, can significntly reduce basis risk.
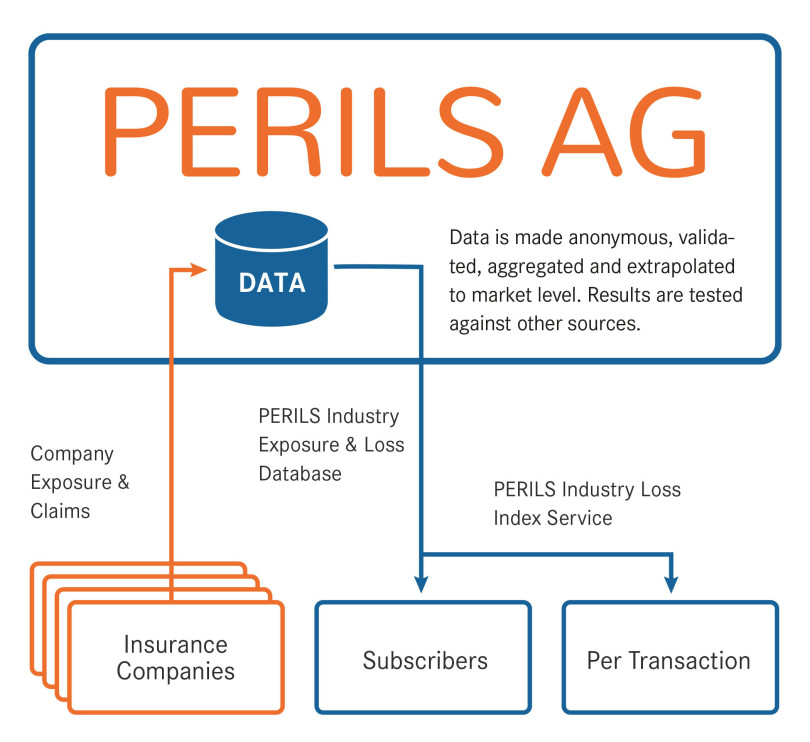
PERILS collects its data directly from insurance companies underwriting business in the covered territories. Data provision is based on a contractual agreement (the Data Provider Agreement) between PERILS and each of the data-providing insurance companies.
The data provided include exposure data (sums insured) by CRESTA zone and by country, property premium data by country, and event loss data by CRESTA zone and by country. This company data is made anonymous upon receipt and is tested for quality and completeness using standardized data quality and completeness checks. The data is then added to the data which has already been accepted within the identical aggregation units in the PERILS database. The original raw company data is deleted at this stage in compliance with applicable antitrust and competition laws.
Aggregated company data within the identical aggregation units is extrapolated to industry-level (i.e. market-level) using published market property premium information per country. The latter is broken down into individual aggregation units using population data and other proxy data. Company property premium data per country is broken down into individual aggregation units using average rates as derived from provided sums insured and premium data. The relationship between market premium and company premium then gives the market coverage per aggregation unit. The latter is used to extrapolate event loss data per aggregation unit to industry-level (i.e. market-level). The calculated industry event loss is subsequently tested against information from national authorities and insurance industry sources, as well as meteorological and other scientific data. This ensures the highest possible degree of data quality and realism.
It is important to note that the reverse engineering of PERILS industry data is not possible, i.e. the data providing sources cannot be reconstructed and their anonymity is assured.
Flowchart illustrating the PERILS methodology. After data collection from insurance companies, data is made anonymous and aggregated within the identical aggregation units followed by extrapolation to industry level.