The PERILS Industry Exposure & Loss Database provides high-quality, up-to-date insurance market data for natural catastrophes. It consists of two complementary products, each with a distinct methodology:
PERILS CORE – covers the countries and perils listed below. It includes both the Industry Exposure Database and the Loss Database, based on data collected directly from primary insurance companies and extrapolated to market/industry level.
PERILS EXTENDED – covers all other countries and perils not included in CORE (worldwide, excluding the US). It provides industry loss data only, compiled from multiple public and non-public sources, and calculated using PERILS’ weighted-average approach for industry loss estimation, as outlined in the PERILS Description.
Australia, Canada, Indonesia (exposure data only), Italy, New Zealand, Philippines (exposure data only), Thailand (exposure data only), Turkey
Extratropical Windstorm
Australia, Austria, Belgium, Canada, Denmark, France, Germany, Ireland, Luxembourg, Netherlands, New Zealand, Norway, Sweden, Switzerland, United Kingdom
Flood
Australia, Austria, Belgium, Canada, Denmark, France, Germany, Indonesia (exposure data only), Ireland, Italy, Japan, Luxembourg, Netherlands, New Zealand, Norway, Sweden, Switzerland, Thailand (exposure data only), Turkey, United Kingdom
Hail / Convective Storm
Australia, Austria, Belgium, Canada, France, Germany, Ireland, Italy, Japan, Luxembourg, Netherlands, New Zealand, Switzerland, United Kingdom
Tropical Cyclone
Australia, Japan, Philippines (exposure data only)
Volcanic Eruption
Canada
Australia
Fire
Earthquake
Extratropical Windstorm
Flood
Hail / Convective Storm
Tropical Cyclone
Canada
Fire
Earthquake
Extratropical Windstorm
Flood
Hail / Convective Storm
Volcanic Eruption
Austria, Belgium, France, Germany, Ireland, Luxembourg, Netherlands, Switzerland, United Kingdom
Extratropical Windstorm
Flood
Hail / Convective Storm
Denmark, Norway, Sweden
Extratropical Windstorm
Flood
Indonesia (exposure data only), Thailand (exposure data only), Turkey
Earthquake
Flood
Italy
Earthquake
Flood
Hail / Convective Storm
Japan
Flood
Hail / Convective Storm
Tropical Cyclone
New Zealand
Earthquake
Extratropical Windstorm
Flood
Hail / Convective Storm
Philippines (exposure data only)
Earthquake
Tropical Cyclone
For the definition of perils, PERILS follows ACORD standard (www.acord.org)
Event loss per country available six weeks after the event and updated after three months.
Event loss per CRESTA zone and occupancy type available after six months and updated after twelve months. Reports typically include physical intensity measures such as gust speed values.
Further updates as deemed necessary by PERILS. Event loss reporting closed in any case 36 months after event date.
It is PERILS' goal to include in the third and all following loss reports for each event an event intensity measure (such as modelled and observed gust values).
Geographical resolution: CRESTA (www.cresta.org)
Combined with market sums insured and event loss data, both available per CRESTA, event intensities allow to derive market-specific vulnerability functions or to validate the damageability function in catastrophe risk models.
Exposure, event loss and damage degree benchmarking.
Natural catastrophe risk model validation.
Exposure-based business planning, pricing and accumulation control of industry-based covers (ILS, ILW).
Design of adequate reinsurance and retrocession protections including appropriate triggers.
The PERILS Industry Exposure & Loss Database also provides an excellent basis for assessing the risk of industry loss-based (re)insurance or retrocession covers. Both the PERILS industry exposure and event loss data are based on exclusive reports provided by identical sources. By analyzing the PERILS industry exposure portfolio with a probabilistic risk assessment model, the expected loss of industry loss-based covers can be determined with an index-consistent exposure portfolio.
The PERILS industry exposure database can also be used to evaluate the correlation between multiple industry loss-based ILS/ILW commitments. As such, the PERILS industry exposure database can serve as a foundation for ILS/ILW portfolio optimization and accumulation control.
The PERILS Industry Exposure & Loss Database provides new benchmarks for evaluating insurance portfolios using market exposure (sums insured) and market event loss data (insured loss amounts). Both are key market measuring sticks and complement current premium-based market position indicators. The new insights gained from this can be used in portfolio steering, claims management and strategic business planning.
The PERILS Industry Exposure & Loss Database serves as an excellent source for validating probabilistic catastrophe risk models. Post-event risk model calibration, which is currently being carried out using a variety of sources with varying event loss estimates and industry exposure portfolios, may now be performed using the new PERILS benchmark data. In addition, by comparing the PERILS event loss data with the PERILS industry exposure, it becomes possible to derive damage degrees and to correlate them with event intensity measures provided by PERILS, such as modelled and observed gust values. This also enables the validation of the damageability function in catastrophe risk models.
PERILS Industry Data contribute to risk-based solvency assessments by allowing the benchmarking of exposures, event losses and modelled losses against the market. Furthermore, custom-made triggers for fully collateralized ILS and ILW transactions are provided by the PERILS Industry Loss Index Service. In combination, this helps to address both basis risk as well as credit risk concerns, which are both central to state-of-the-art solvency regulations.
PERILS Industry Loss Index Service (Loss Indices) allows the use of PERILS industry loss estimates as triggers in Insurance Linked Securities (ILS), Industry Loss Warranty contracts (ILW) or insurance risk derivatives. The Loss Indices are based on actual insured loss information collected directly from insurance companies writing property business in the affected territories. Structured triggers, with the use of weighting factors per CRESTA, country and/or Line of Business, can significntly reduce basis risk.
PERILS CORE – Industry Loss Estimation Methodology
For PERILS CORE industry loss estimation, aggregated company event loss data within the identical aggregation units is extrapolated to industry-level (i.e., market-level) using sums insured market share information. For the first two loss declarations, aggregated company event loss data per country is extrapolated to industry-level using sums insured market share information per country. For all subsequent loss declarations, aggregated company event loss data per aggregation unit is extrapolated to industry-level using sums insured market share information per aggregation unit.
If market coverage is insufficient to calculate a reliable industry event loss estimation, professional judgment is applied by PERILS, in its sole discretion, to adjust the calculated industry event loss data. In making these judgments, PERILS may consider various factors, such as meteorological and/or other scientific data, as well as information provided by national and local authorities or insurance industry sources, as it deems appropriate in the particular circumstances.
In order to preserve its flexibility to adjust to external circumstances and enhance the quality of the PERILS CORE industry loss product, PERILS may, in its sole discretion, change its general event loss estimation methodology at any time and modify the application of its methodology.
PERILS EXTENDED - Industry Loss Estimation Methodology
For PERILS EXTENDED industry loss estimation, PERILS applies a weighted-average approach of industry loss estimates of available sources for a given event. In case an information source is lacking coverage of certain territories or lines of business, PERILS may still consider the source and perform adjustments for the missing territories or lines of business before including the source in the PERILS EXTENDED industry loss assessment. For the determination of the weights and the possible adjustment of the individual data sources, PERILS applies its professional judgment at its sole discretion, following the guiding principles of accuracy, objectivity and traceability. The weighting of the information sources follows the principle of reliability and trustworthiness and can range from 0 to 100%. Allocated weights for a given event are reviewed each quarter and may be adjusted over time. In addition, as time passes after an event, new sources may become available and included in the assessment while previously used sources may become outdated and hence discarded (i.e. 0% weight).
In order to preserve its flexibility to adjust to external circumstances and enhance the quality of the PERILS EXTENDED industry loss product, PERILS may, in its sole discretion, change its general event loss estimation methodology at any time and modify the application of its methodology.
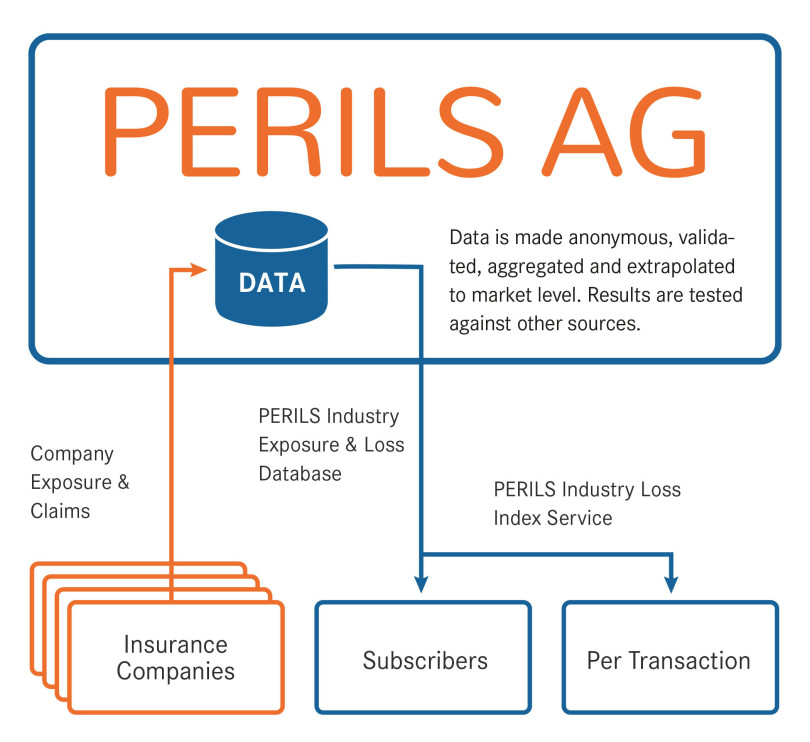
Flowchart illustrating the PERILS methodology. After data collection from insurance companies, data is made anonymous and aggregated within the identical aggregation units followed by extrapolation to industry level.